11 November 2025
Reading a Piping and Instrumentation Diagram
How to walk a P&ID from feed tank to product cooler without losing the story of valves, instruments, and relief paths.
11 November 2025
How to walk a P&ID from feed tank to product cooler without losing the story of valves, instruments, and relief paths.
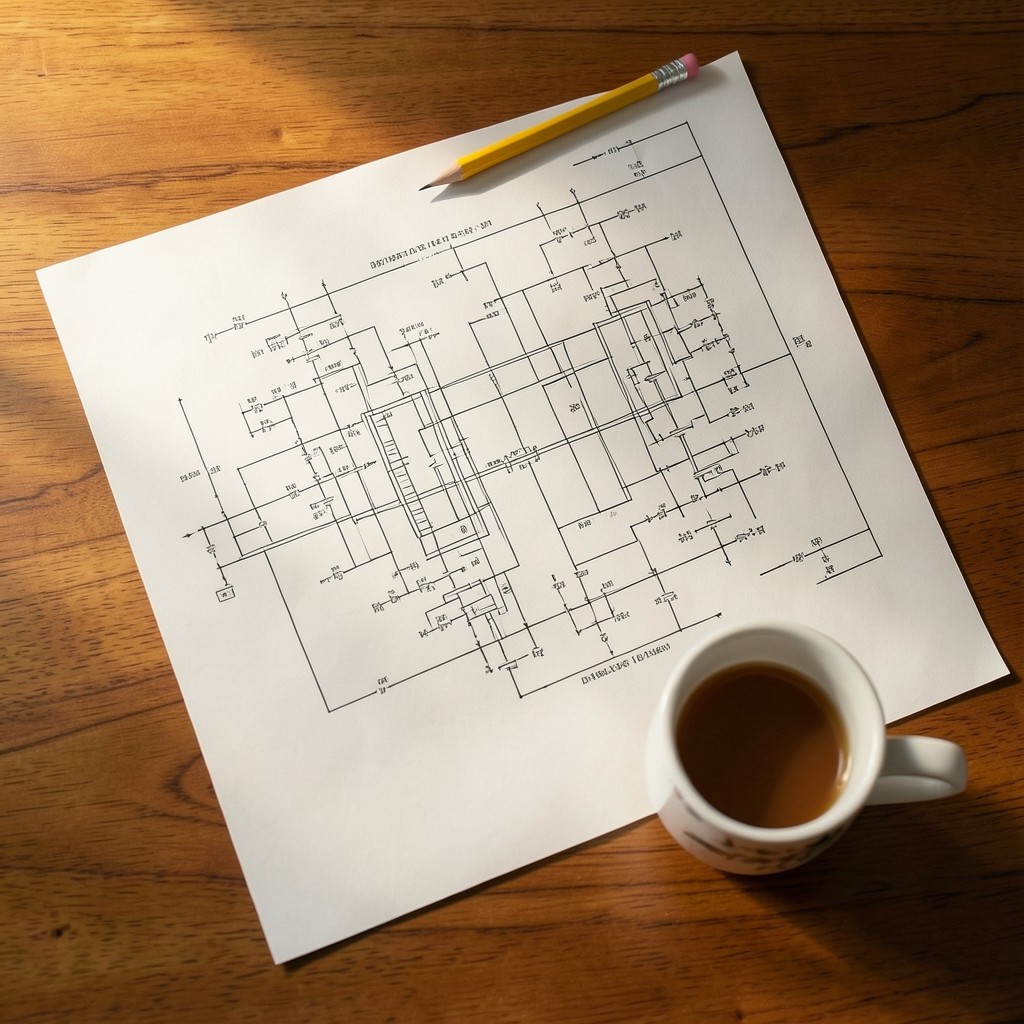
A piping and instrumentation diagram is a working map, not a decorative wall chart. Start at the main process stream and follow the line weight that carries the largest mass flow. Ignore utility headers until you understand where the product goes.
Tag numbers tell you who owns the measurement. A TI is a temperature indicator; a TIC adds control. When you see a cascade loop, ask which variable is the master and which is the slave before you propose a set-point change.
Relief devices deserve a second pass. Note the protected equipment, the set pressure, and whether discharge goes to atmosphere, flare, or a catch tank. On a teaching P&ID at Cedarfield we deliberately leave one ambiguous discharge path so learners practice asking the right question.
Before you leave the drawing, sketch a one-paragraph narrative: feed condition, primary transformation, product destination, and the two instruments you would watch first on start-up. That narrative is more useful in a handover than a list of every valve tag.